Contents
  What can the profiler do?
  Profiling Modes
  Profiler UI
  Limitations
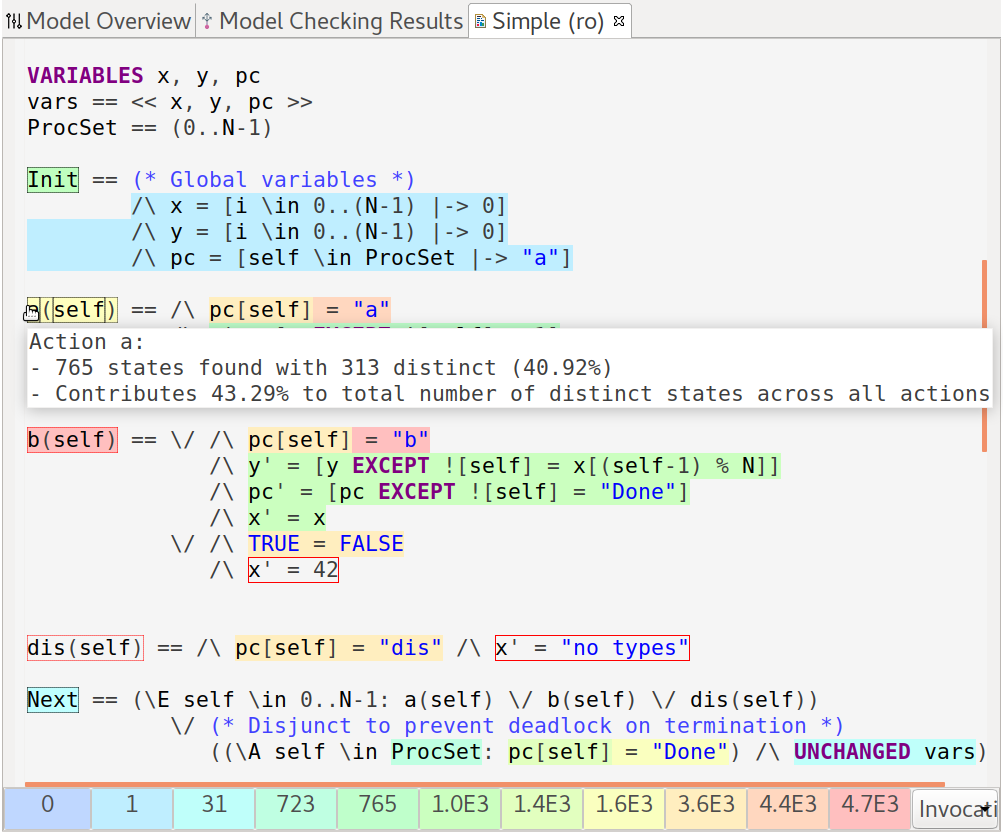
Profiling a specification is similar to profiling implementation code: During model checking, the profiler collects evaluation metrics about the invocation of expressions, their costs, as well as action metrics. The number of invocations equals the number of times an expression has been evaluated by the model checker. Assuming an identical, fixed cost for all expressions allows to identify the biggest contributor to overall model checking time by looking at the number of invocations. This assumption however does not hold for expressions that require the model checker to explicitly enumerate data structures as part of their evaluation. For example, let S be a set of natural numbers from N to M such that N << M and \A s \in SUBSET S : s \subseteq S be a expression. This expression will clearly be a major contributor to model checking time even if its number of invocations is low. More concretely, its cost equals the number of operations required by the model checker to enumerate the powerset of S. Users can override such operators with more efficient variants. Specifically, TLC allows operators to be overridden with Java code which can often be evaluated orders of magnitudes faster.
Evaluation metrics are captured globally and at the call-chain level. In other words, the metrics for an expression such as a operator, that occurs in two or more expressions, will be reported individually for each occurrence. Metrics are furthermore sensitive to constants such that the change of a constant value - across model checker runs - will be detectable in the metrics unless the constant has no influence at all.
Action metrics, which are orthogonal to evaluation metrics and are not found in an implementation profiler, are the total number of states and distinct states found which are reported at the action level.
The profiler neither requires the specification nor the model to be modified in order to collect metrics.
